
Prometheus 3.16 makes queries report their cost, and promotes anchored and smoothed selectors
3.16 adds opt-in query cost estimation and configurable limits, promotes anchored and smoothed selectors to stable, and clamps the search API's batch_size to 1000.
Prometheus 3.16.0 landed on November 4. The project has felt steady to the point of being boring for years: every release is a list of [CHANGE], [FEATURE] and [PERF] entries that reads like an engineering log. One line in this one made me stop.
--enable-feature=query-cost
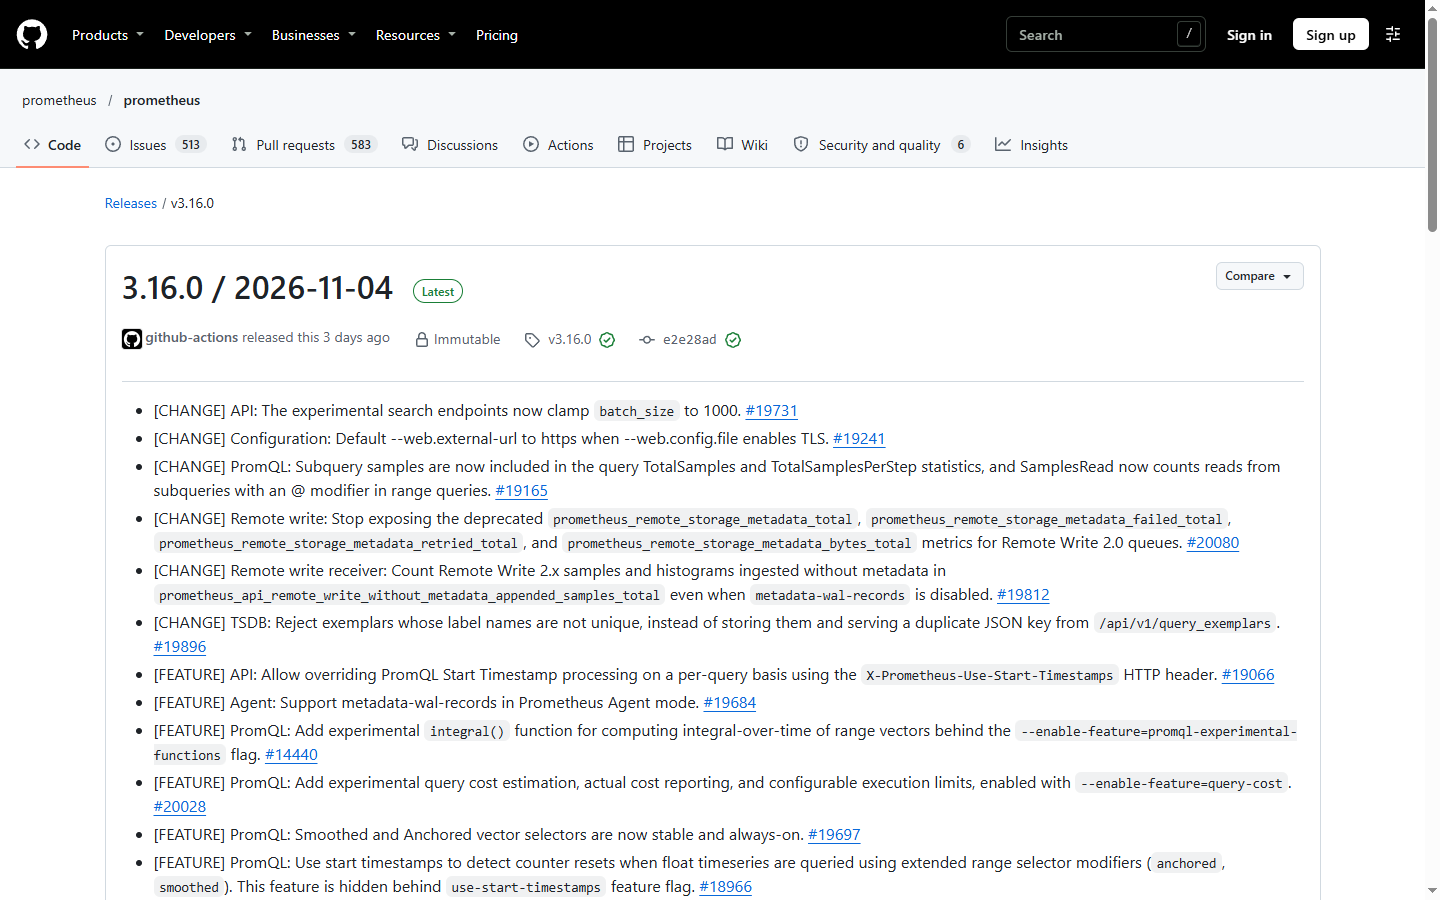
Query cost: from “find out after it runs” to “look before it runs”
With the feature on, PromQL can do three things: estimate a query’s cost, report the actual cost, and enforce configurable execution limits.
Why it matters needs a bit of context about running monitoring. The classic Prometheus outage is not “it crashed”. It is “someone wrote a rate() with a range that is too wide and took down TSDB and the query process with it”. Such queries look fine when written: valid, fast to type, correct results, they just scan three months of data.
Cost estimation moves that from post-mortem to refusal. You can set limits per tenant or per endpoint and return an error when they are exceeded. Refusing one query before it collapses the server beats explaining why every dashboard went blank.
anchored and smoothed: experimental to always-on
Both selectors have existed behind --enable-feature since 2024. This release makes them stable and permanently enabled.
They solve something specific. When rate() crosses a counter reset at a window boundary, it splits the reset between two windows and reports a peak that is too low. anchored snaps windows to real boundaries; smoothed interpolates across them. For anyone doing SRE work, this is the kind of bias you cannot unsee once you know it exists.
The same release refines the edge cases: for float series using anchored or smoothed selectors, counter resets are detected with start timestamps, hidden behind use-start-timestamps.
Other items worth your attention
| Change | Impact |
|---|---|
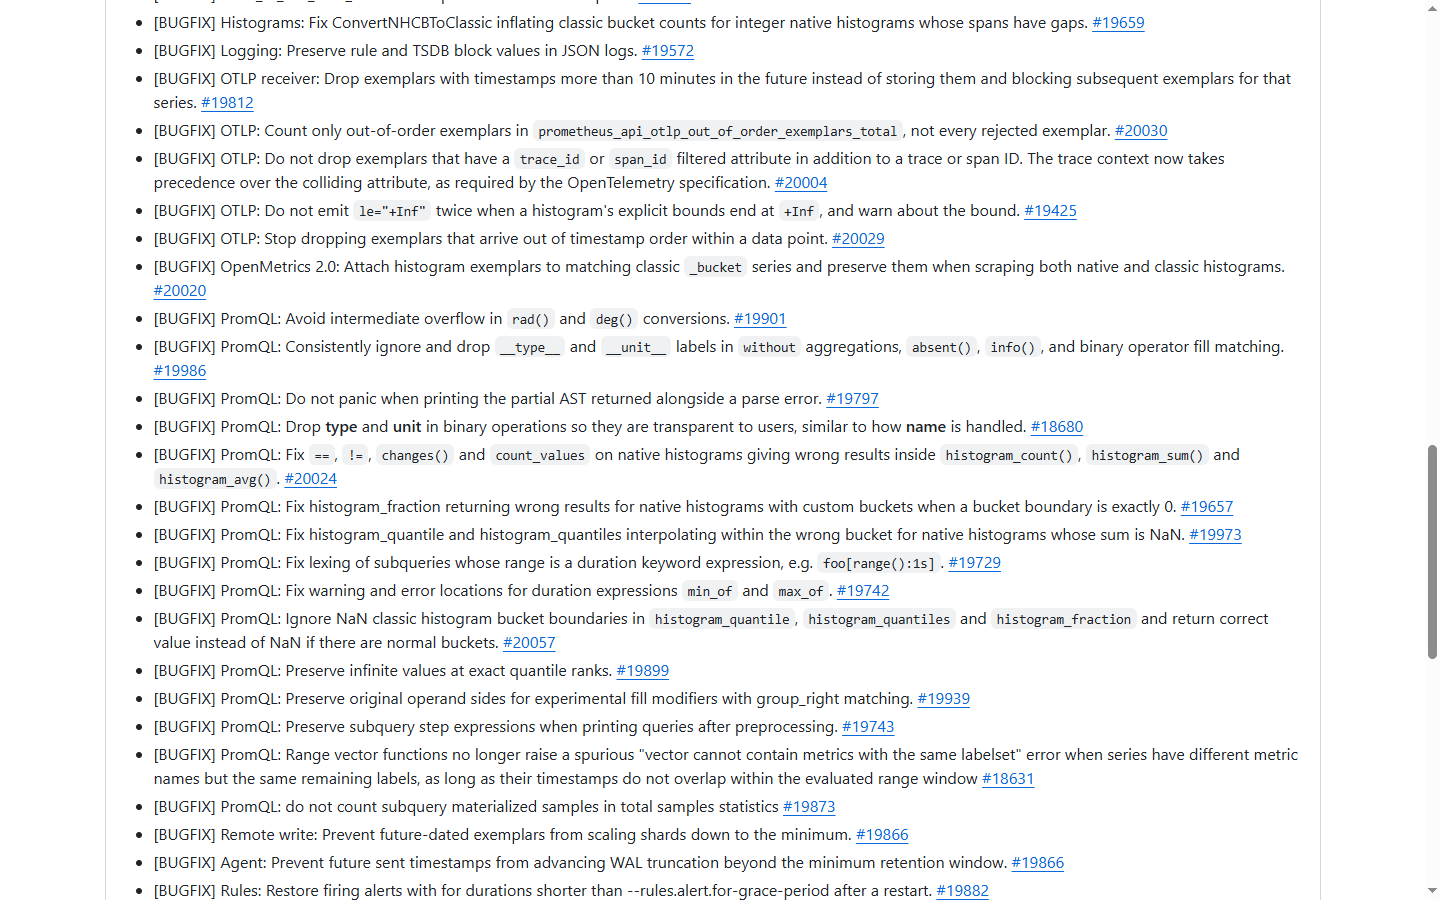
Experimental search API clamps batch_size to 1000 |
One expensive search can no longer exhaust memory |
--web.external-url defaults to https when --web.config.file enables TLS |
One less “the shared link is http” bug |
| TSDB rejects exemplars with duplicate label names | They used to be stored and served as duplicate JSON keys |
| promtool prints the test filename | You finally know which file failed |
--allow-incompatible-block-duration |
No longer restricted to default block durations |
The performance section is meaty too: XOR2 compression choosing windows by encoding cost, per-series metadata deduplicated with unique.Handle, cached OTLP histogram names, reused OpenMetrics 2.0 buffers.

Upgrade notes
3.16 is a minor release with no breaking changes, but two defaults moved: the external-url scheme and search batch_size. If your instance mounts --web.config.file and relies on http external URLs, check reverse-proxy and alert links after upgrading.
As for query-cost, I will turn it on in staging for a week first and collect data on which queries would have been rejected, then pick thresholds. Limits in a monitoring system should not be guessed. The first query you reject is usually the only one that would have explained the outage.
Comments
…