
Grafana 13.3 fixes ten CVEs, then quietly makes panel subtitles and the auto grid the default
The 13.3.0 changelog opens with ten CVE fixes before any features: panel subtitles, the auto grid as default, and server-side search for Recently Deleted come after.
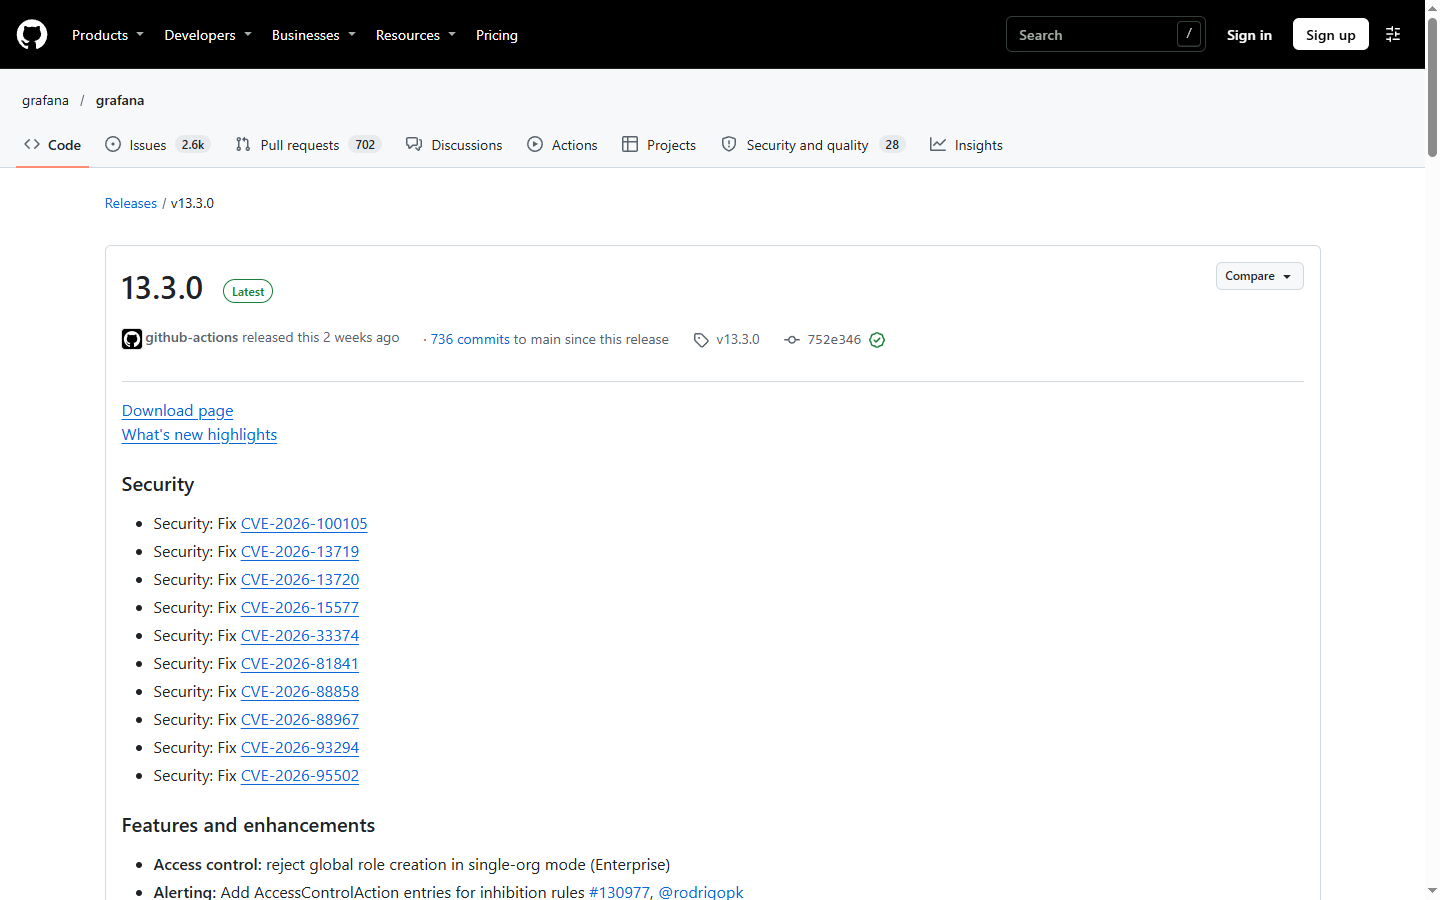
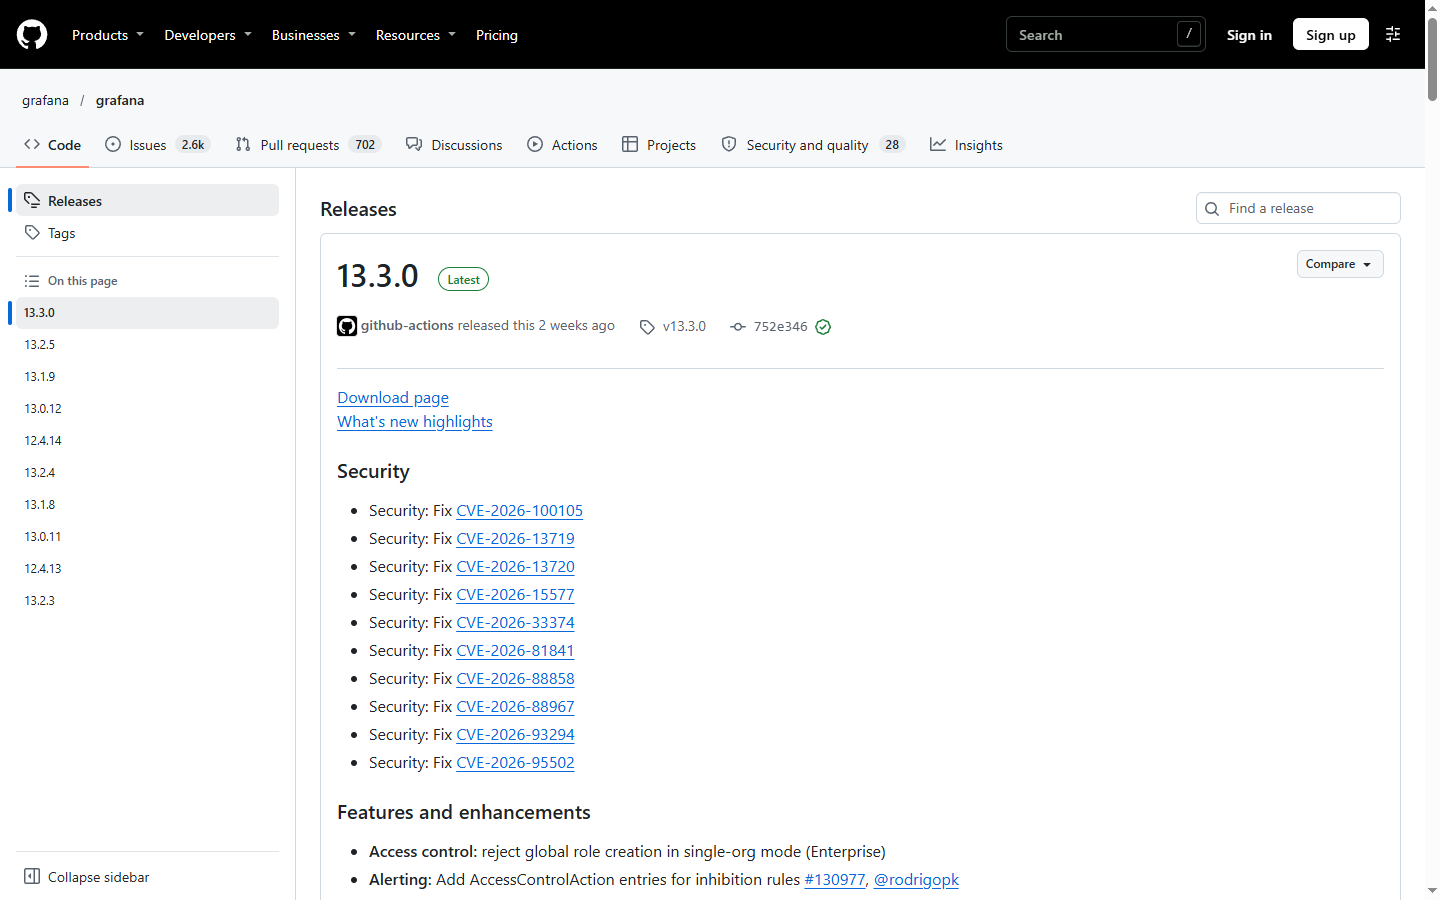
Grafana 13.3.0 shipped on October 27. I opened the release page and scrolled, and the first screen was one repeated sentence:
Security: Fix CVE-2026-…
Ten of them. Ten CVEs in one release.
What ten CVEs tells you
The conclusion is not “Grafana got worse”. It is that their disclosure cadence is batched. The security team ships accumulated fixes in one patch release instead of leaking a signal with each individual release. The only correct response for an operator is: do not skip minor releases.
I will not list the identifiers here, because a CVE number out of context is not useful. What is useful:
- Is your Grafana exposed publicly, or reachable by non-admin users? Then this patch goes near the top.
- Do you have anonymous access, Viewer roles, or public snapshots, configurations with thin permission boundaries? Same answer.
- Third-party data source plugins are not covered by Grafana’s own fixes.
The feature side: small things you touch daily
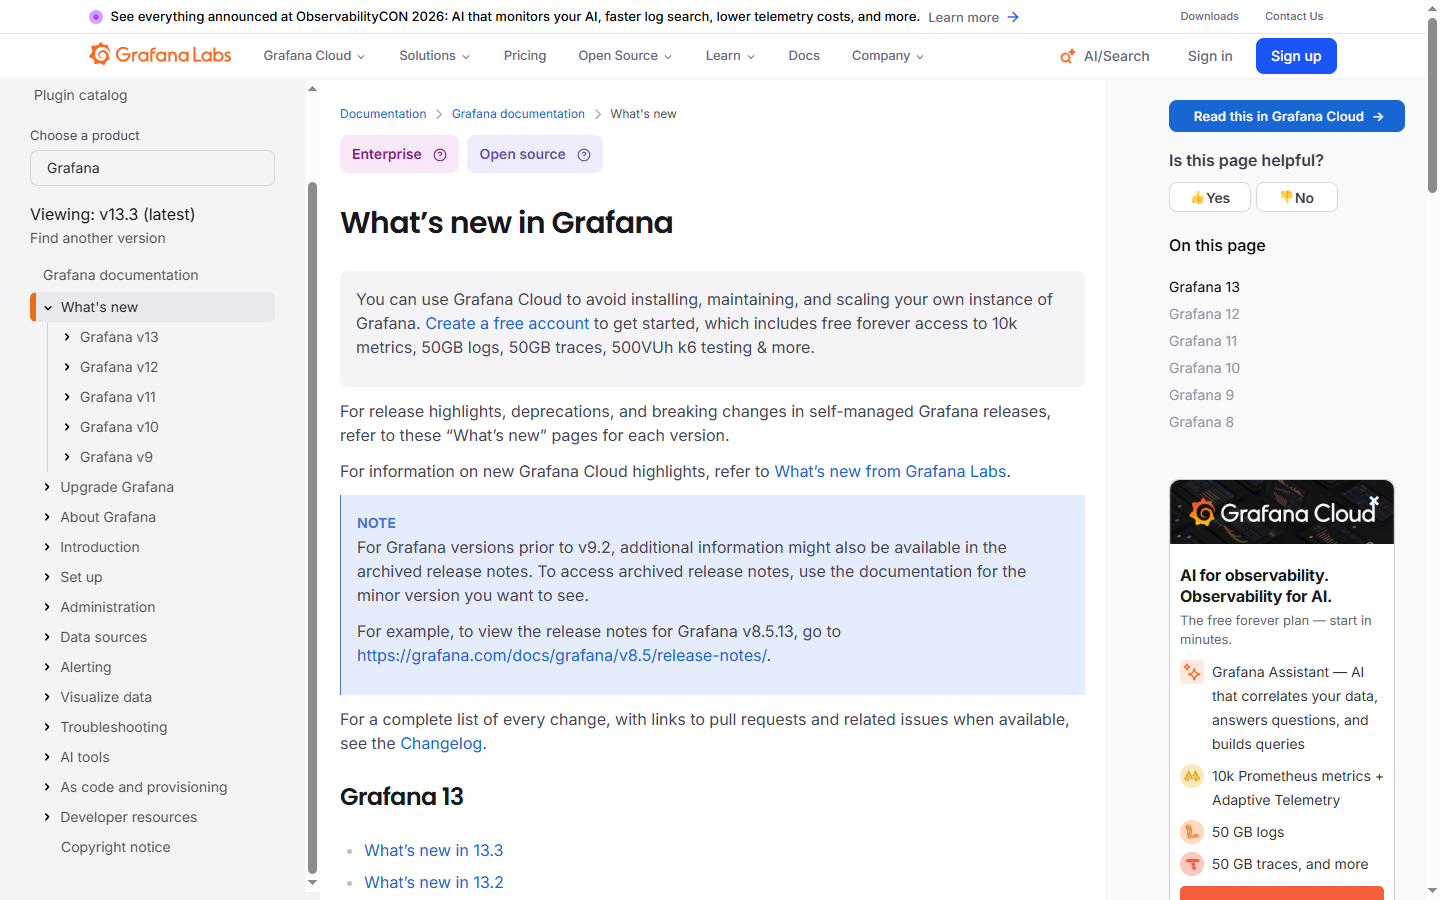
Beyond security, 13.3 is mostly polish:
- Panel description subtitles: a title line plus a description line instead of one crowded paragraph
- Auto grid becomes the default: new panels arrange themselves
- Recently Deleted uses server-side search: that page used to become unusable once enough dashboards piled up
$__namespaceglobal variable: one less template layer for multi-namespace deployments- Standalone Canvas plugin loads by default
Alerting got the largest feature push: the GMA import wizard moves from “can I import” to “does it stay in sync”, with external Alertmanager config sync, sync health surfaced in settings, and secrets redacted in the import preview. That is what treating alerting as infrastructure looks like.
How I upgrade monitoring systems
My rule is “follow patches closely, follow majors slowly”, and security-plus-polish minors like 13.3 are the exception worth taking. In practice:
- Upgrade a test instance first and check data source plugins and alert rules
- Back up
grafana.dband your provisioning directory - After upgrading, open your three most-used dashboards. A broken dashboard hurts judgment more than a broken service
- Recheck silences and notification channels; notifications are the thing that silently stops working after a version bump
Last thought: the value of a charting tool is that you trust it when things go wrong. A Grafana that has not been upgraded in two years is missing more than ten CVE fixes. It is missing your confidence.
Comments
…